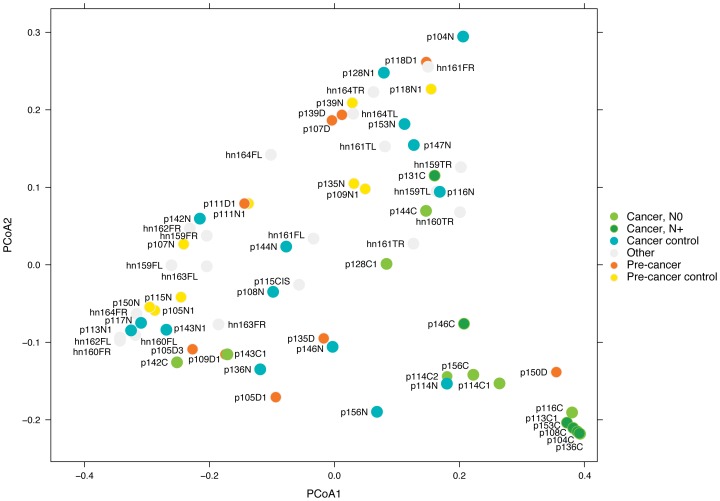
Figure 4. Distinguishing cancer and normal samples.
PCoA based on Weighted UniFrac distance between samples given abundance of 12 OTUs. Axis 1 (PCoA1): 54% of variation explained. Axis 2 (PCoA2): 24% of variation explained. N0 and N+ indicate the nodal status of the cancer patient, N0 = node negative, N+ = node positive. Cancer control and pre-cancer control are contralateral clinically normal patient samples. Other identifies samples from healthy normal individuals.

