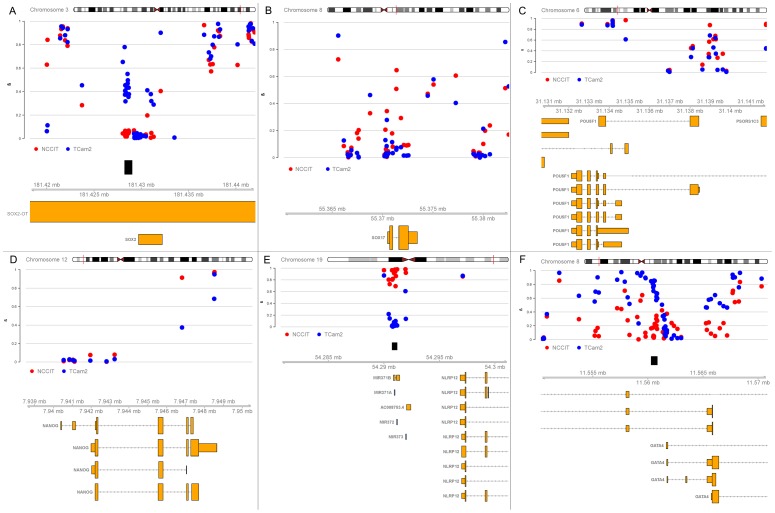
Figure 3. Methylation patterns of known germ cell markers (A–D) and significant DMRs for both cell lines (E, F).
Dots depict individual CpGs and black boxes denote DMRs identified by DMRforPairs. Percentages below indicate average CG density in the plotted regions (calculated using the Repitools R package, gcContentCalc function (http://www.bioconductor.org/)). (A) SOX2 [44%], (B) SOX17 [46%], (C) OCT3/4 (POU5F1), [52%] (D) NANOG, [44%] (E) miR-371/2/3 cluster, [49%] (F) GATA4 [53%].

