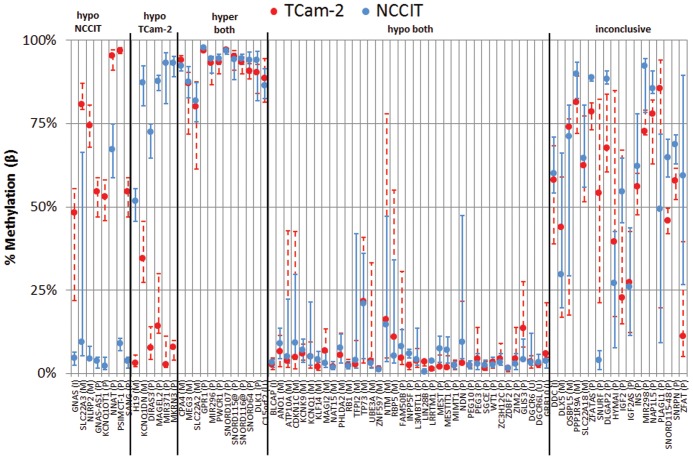
Figure 4. Methylation patterns in promoter regions of imprinted genes.
Localization of TSS was retrieved from Ensembl and manually corrected for genes with multiple transcripts to select a region with representative coverage on the Illumina BeadChip (nprobes varied between the genes: median = 10, inter-quartile range 6–21). Promoter region was defined as TSS-1000–TSS+100 (or opposite on reverse strand). Genes with >0.25 difference in median β and a consistent (stable) methylation pattern were identified as differentially methylated at the TSS between the two cell lines. Median methylation <25% for both cell lines was interpreted as a hypomethylated state in both cell line. Median methylation >75% was interpreted as hypermethylation. No probes were annotated around the TSS of TCEB3C (M), RNU5D (P), SNORD108 (P), SNORD109A (P) and SNORD109B (P). SANG and GNAS-AS1 are known aliases but separate entities on geneimprint.com and are depicted separately to preserve consistency. P = paternally imprinted/expressed, M = maternally imprinted/expressed, I = isoform-dependent imprinting.

