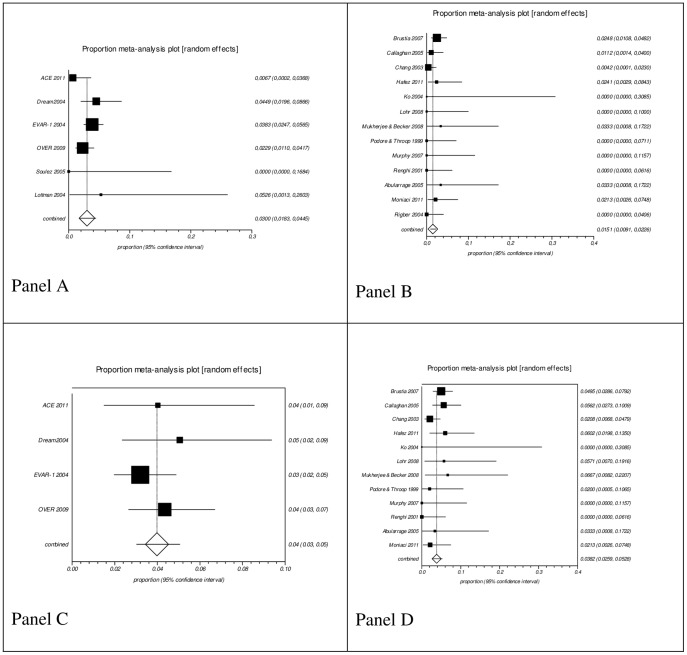
Figure 2. Pooled analysis of proportions from case series.
Panel A: Conventional care series mortality; Panel B: ERAS series mortality; Panel C: Conventional care series morbidity; Panel D: ERAS series morbidity. Morbidity results are shown as the absolute number of patients with at least one complication, including acute myocardial infarction, renal failure and stroke. No effect differences were seen due to the overlap of the 95% confidence intervals.

