
Figure 2.
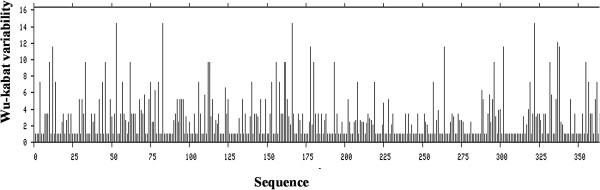
Protein variability index of the conserved peptide. The protein variability index of the conserved peptide was determined by using PVS server [24]. The conservancy threshold was 1.0 in this analysis. X axis indicates the amino acid position in sequences and Y axis indicates the Wu-kabat variability.