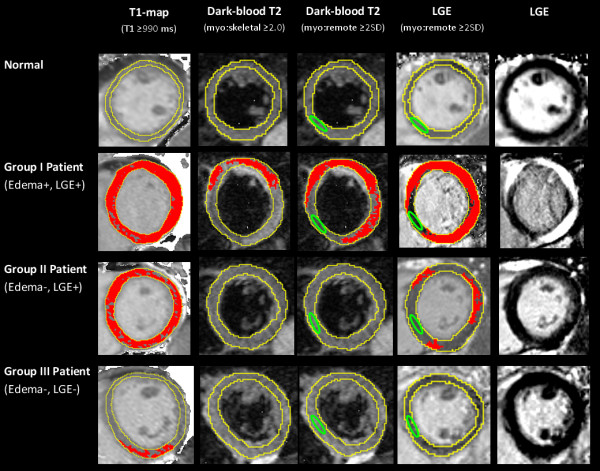
Figure 2.

T1-maps detected the location and extent of myocardial injury in acute myocarditis. Areas of myocardial injury (red) as detected by computer-aided analysis of T1-maps, T2-weighted and late gadolinium enhanced (LGE) images in a normal subject (row 1) and patients with acute myocarditis (rows 2–4). Red indicates areas of myocardium with values above the stated threshold for each method. Green contour marks the position of reference region of interest (ROI). Skeletal muscle ROI for T2W images not shown. Note that a T1 cut-off of ≥ 990 ms detected larger areas of injury than corresponding T2W and LGE imaging analysis.
