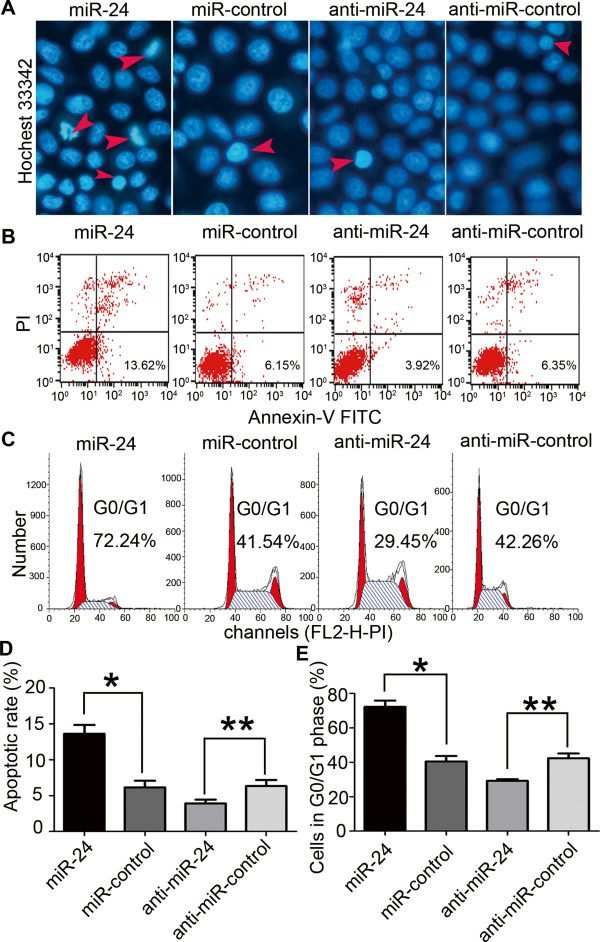
Figure 3.

miR-24 induced cell apoptosis and G0/G1 cell cycle arrest. (A) Representative histograms depicting nuclear morphology of SGC-7901 cells transiently transfected with 100 nM miR-24 mimics or inhibitor and their respective controls (Hoechst33342 staining, original magnification 400×). (B) Representative histograms depicting apoptosis of SGC-7901 cells transiently transfected with 100 nM miR-24 mimics or inhibitor and their respective controls. (C) Representative histograms depicting cell cycle of SGC-7901 cells transiently transfected with 100 nM miR-24 mimics or inhibitor and their respective controls. (D, E) The percentage of apoptotic and G0/G1 phase cells of three independent experiments, mean ± S.D. (*P < 0.05, **P < 0.01).
