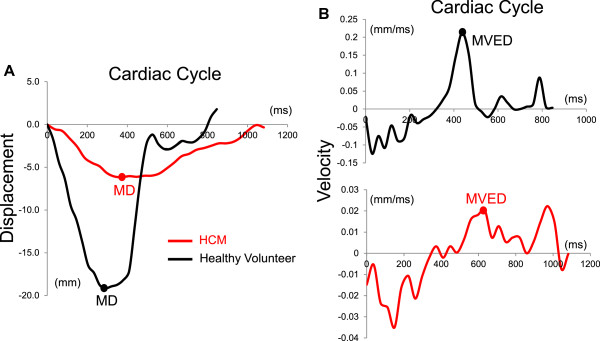
Figure 4.

HCM and healthy volunteer AVJ displacement-versus-time and velocity-versus-time plots. A. Longitudinal AVJ displacement plotted as a function of time during the cardiac cycle in a representative HCM patient (red) and healthy volunteer (black). The healthy volunteer demonstrates a significantly greater MD compared to the patient with HCM. B. Derived from the displacement-versus-time curves, the velocity-versus-time plots show a significantly decreased recoil velocity during early diastole (MVED) in the HCM patient compared to the healthy volunteer. AVJ = atrioventricular junction; HCM = hypertrophic cardiomyopathy; MD = maximum displacement; MVED = maximum velocity early diastole.
