
Fig. 2.
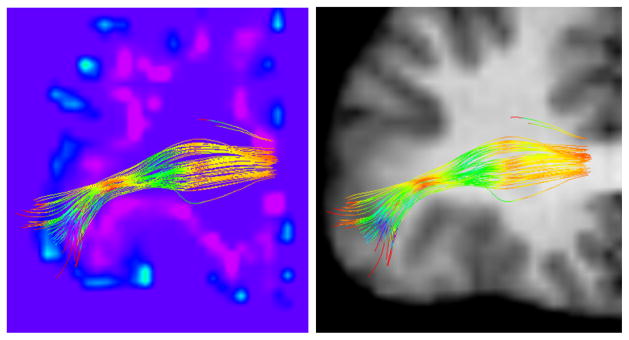
A zoom-in on an anterior coronal view of the right hemisphere with fibers connecting the pars orbitalis. The fibers are colored by TD, such that low TD values are indicated with red/yellow, and high values with green/blue. Please keep in mind that fiber dispersion is a 3D phenomenon. Left: a volume rendering of the mean curvature of the GM/WM boundary surface, such that blue/purple intensities denote the curvature sign and magnitude. Right: the T1 image, shown for anatomical reference.