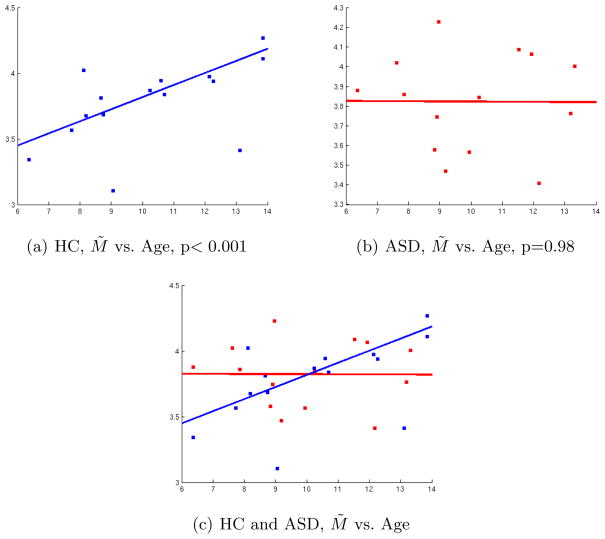
Fig. 3.
Correlation in the Right hemisphere between Age (x-axis) and M̃ = M (Cm, T D). Top row: Control (HC) subjects (Left). ASD subjects (Right). Bottom row: Both groups shown in the same plot. The lines indicate the fit obtained by robust correlation for each group, with the corresponding p-values indicated.

