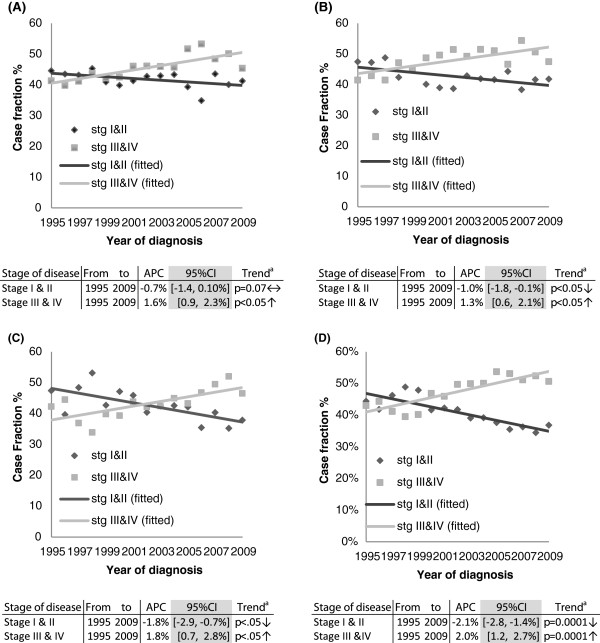
Figure 2.

Case fraction for stage of disease at presentation, by gender and site of tumour for diagnostic period 1994-2009. (A) COLON- FEMALES; (B) COLON MALES; (C) RECTUM- FEMALES; (D) RECTUM - MALES. aThe p-value results are derived from a test of trend. The null hypothesis is that the APC = 0%: Alternative hypothesis is APC ≠ 0%. The APC is the slope of a log-linear regression curve from 1994-2009.
