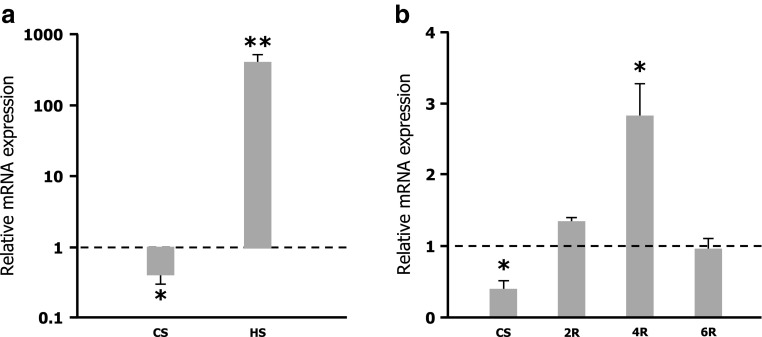
Fig. 4.
a Relative levels of Hsp27 mRNA in larvae exposure at 4 °C (CS) and 35 °C (HS) for 2 h measured by real-time RT–PCR. Note the logarithmic y-axis, where values > 1 indicate upregulation and values < 1 indicate downregulation of the transcript. b Expression of Hsp27 mRNA in larvae exposed at 4 °C (CS) and recovery after exposure for 2 h (2R), 4 h (4R), and 6 h (6R) measured by real-time RT–PCR. The mean ± SEM are shown of measurements taken in three independent biological samples, each with three replicates. The expression level of untreated control larvae was set to 1. Significant differences *p ≤ 0.05, **p ≤ 0.01

