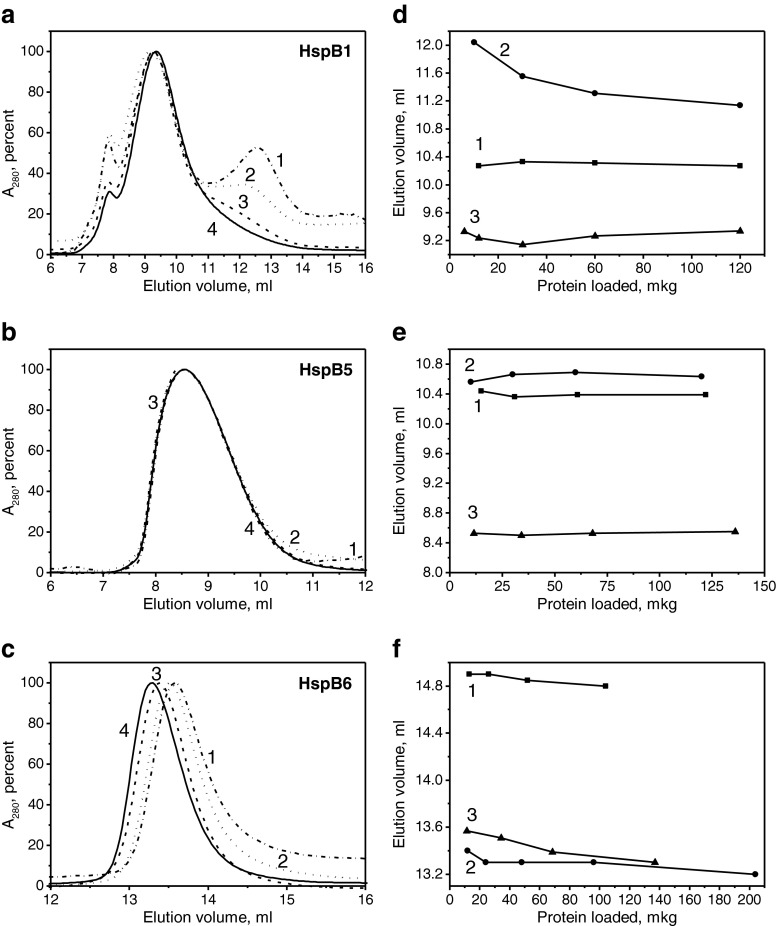
Fig. 1.
Analysis of the oligomeric structure of sHsp and their fluorescent chimeras by SEC. Normalized elution profiles of the C-terminal fluorescent chimeras of HspB1 (a), HspB5 (b), and HspB6 (c). In each case, the column was loaded with 12, 34, 68, or 136 μg of proteins (curves 1–4, respectively). Dependence of the elution volume of the main protein peak on the quantity of protein loaded on the column for the wild-type protein (1) and its N-terminal (2) or C-terminal (3) fluorescent chimeras for HspB1 (d), HspB5 (e), or HspB6 (f)

