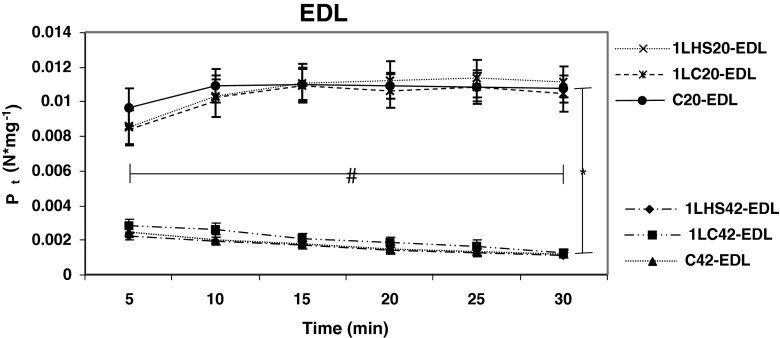
Fig. 2.
Peak EDL twitch tension over 30 min at 20 °C and 42 °C. Peak twitch tension (P t) values were obtained from muscles twitched at 5-min intervals for 30 min. Significant differences (denoted by asterisk) were observed between groups stimulated at 20 °C and 42 °C. Statistical differences (denoted by number sign) were also observed between the 5- and 30-min values in all groups. Significant differences were also observed between temperatures for all time points. Error bars denote SEM

