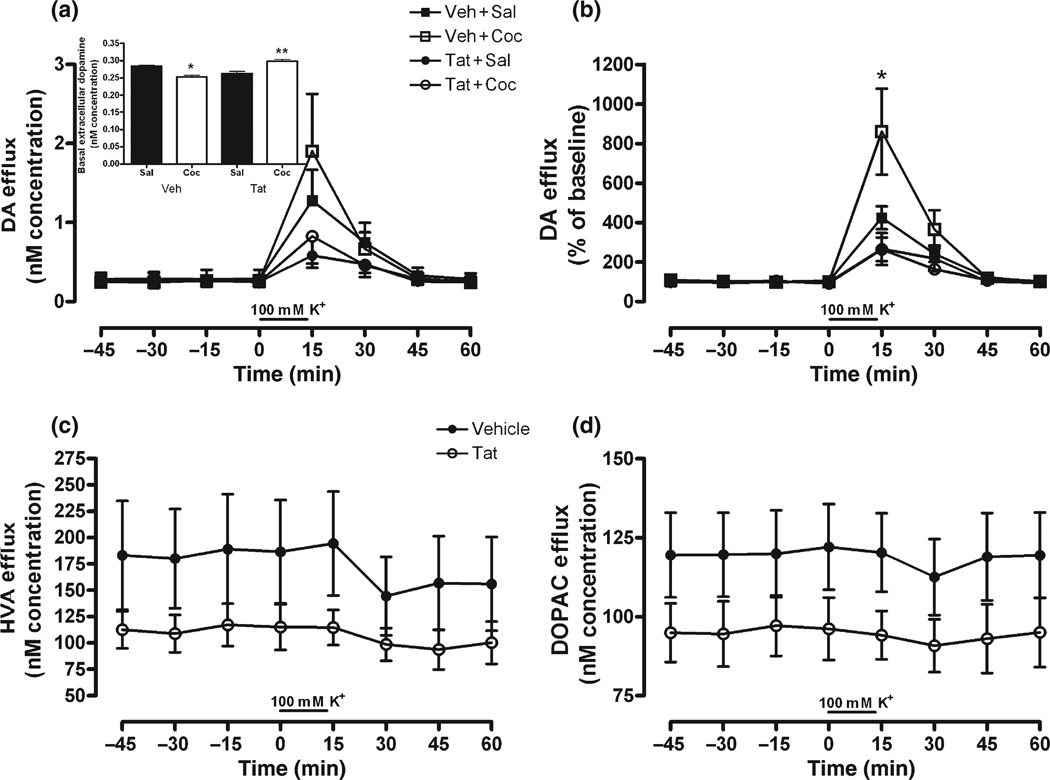
Fig. 4.
DA (a,b), HVA (c), and DOPAC (d) overflow in response to potassium perfusion 72 h following Tat or Veh infusion; represented as concentration (nM; a,c,d) and percent of baseline (b) across time. In addition, significant differences in basal extracellular DA levels are similar to Session 2 differences (a; inset). For metabolites (c,d), Coc-pretreatment had no effect on Tat-induced reduction of DOPAC or HVA levels, therefore Sal/Coc factor was collapsed to show the main effect of Tat-treatment, irrespective of Coc-treatment. Metabolite response to Coc-challenge, expressed as percent of baseline, was no different than Session 1; thus was not presented. Note: Significant planned comparisons following anova noted (*p < 0.05) at each time-point; and for inset, *p < 0.05 and **p < 0.01 for Veh + Coc vs. Veh + Sal and Tat + Coc vs. every other group represented.

