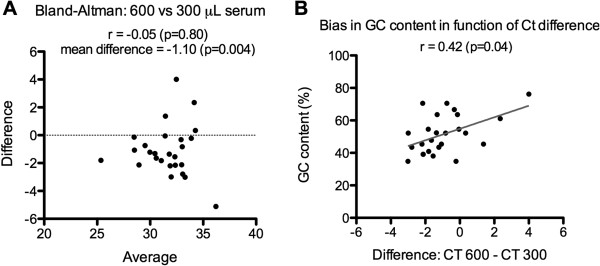
Figure 4.

Assessment of bias in RNA isolation using Macherey-Nagel kit from 300 or 600 μL serum. A- Bland-Altman analysis 600 versus 300 μL of serum. B- Plot of the difference in Ct values of the two conditions (x-axis) and the GC content of the miRNAs detected in these two settings (y-axis). The Pearson correlation coefficient is indicated. The GC content corresponds to the percentage of GC in the sequence of mature miRNAs. TLDA datas from biological duplicate. Analysis using mean CT values of common miRNAs, without Ct cut-off.
