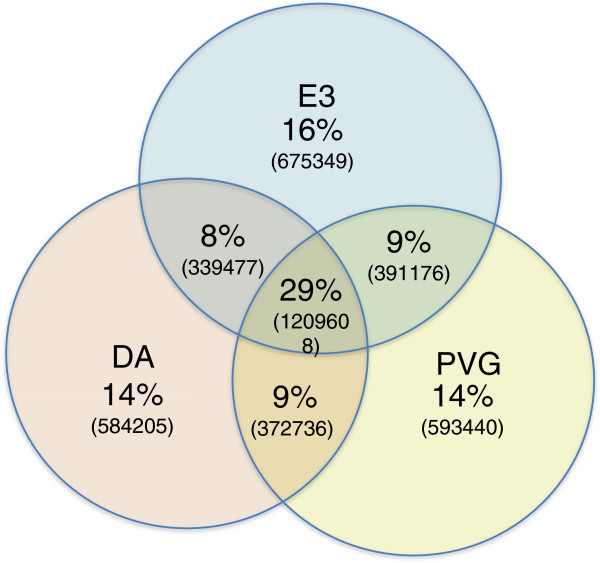
Figure 3.

Sequence similarities/differences between DA, E3 and PVG. Similarity is given as the percentage of SNVs shared between combinations of strains out of all SNVs, after excluding 1.01 M positions where at least one strain is heterozygous or has a coverage below 3. The number of SNVs kept for the analysis was 4166021. Total numbers of SNVs are in parenthesis.
