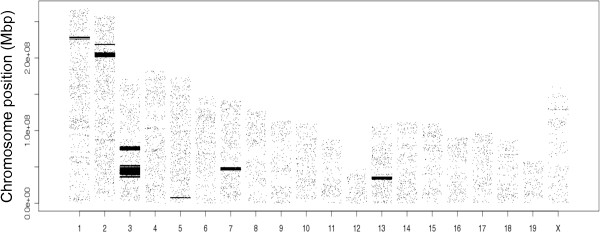
Figure 5.

DA/O and DA/K segregating SNV regions. SNVs between DA/O and DA/K plotted on the chromosomes. The dark bands are due to high SNV density in 8 regions that distinguish DA/O and DA/K. Only positions supported by at least 8 reads in both strains were included in the picture.
