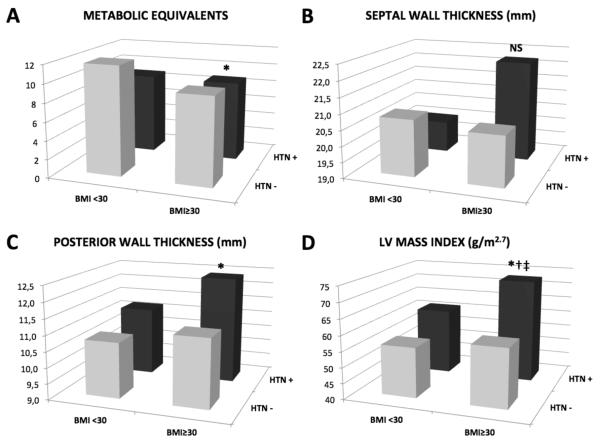
Figure 2. Contribution of obesity and hypertension to exercise tolerance and left ventricular structure.
Metabolic equivalents were significantly lower, and posterior wall thickness and LV mass index significantly higher in patients with obesity and hypertension, while there was no significant difference between groups in septal wall thickness. HTN= hypertension (+=hypertensive, −=normotensive).* p<.05 vs. non-obese normotensive. † p<.05 vs. obese normotensive. ‡ p<.05 vs. obese normotensive. NS= p>0.19 vs. all groups. Formal testing showed a synergistic interaction of BMI and hypertension on LV mass index (p=0.02).

