Figure 1.
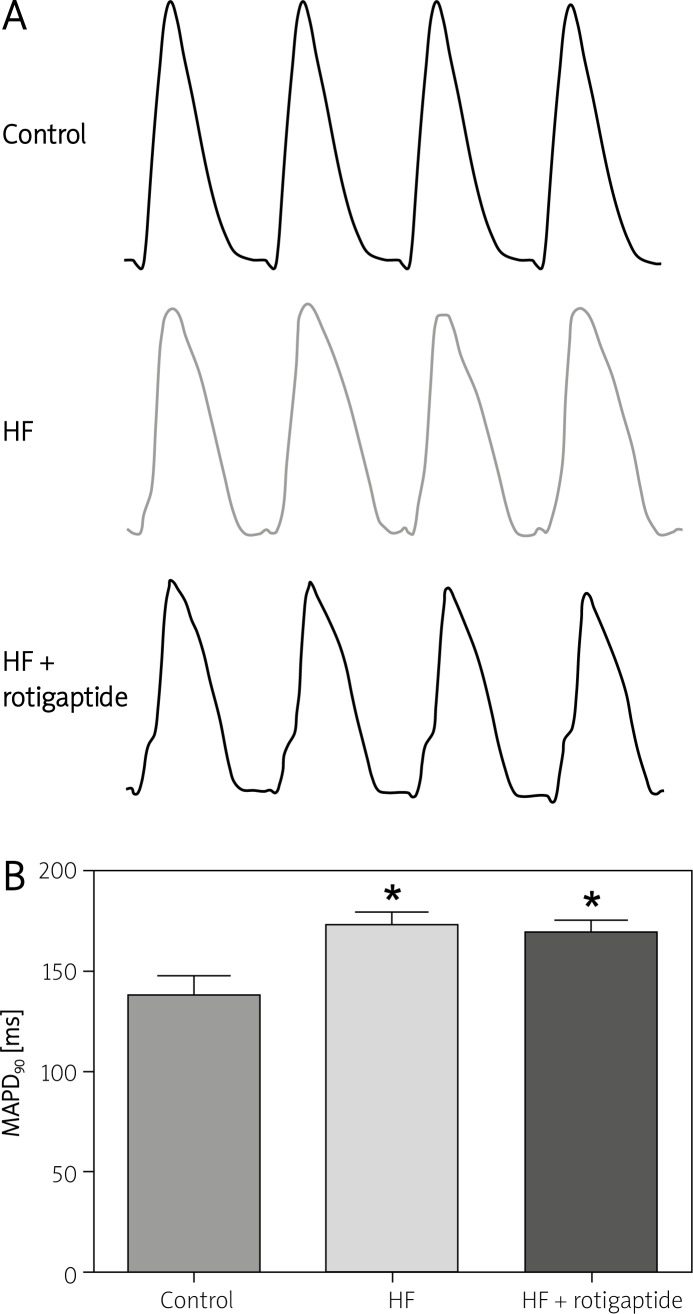
Effect of rotigaptide on MAPD in HF rabbits. A – Representative MAP records in a control, a HF and a HF + rotigaptide rabbit, respectively. B – MAPD90 in all 3 groups. MAPD90 was determined at a basic (S1–S1) cycle length of 300 ms
Data are expressed as mean ± SD, n = 6 in each group.
*p < 0.05 vs. control group.

