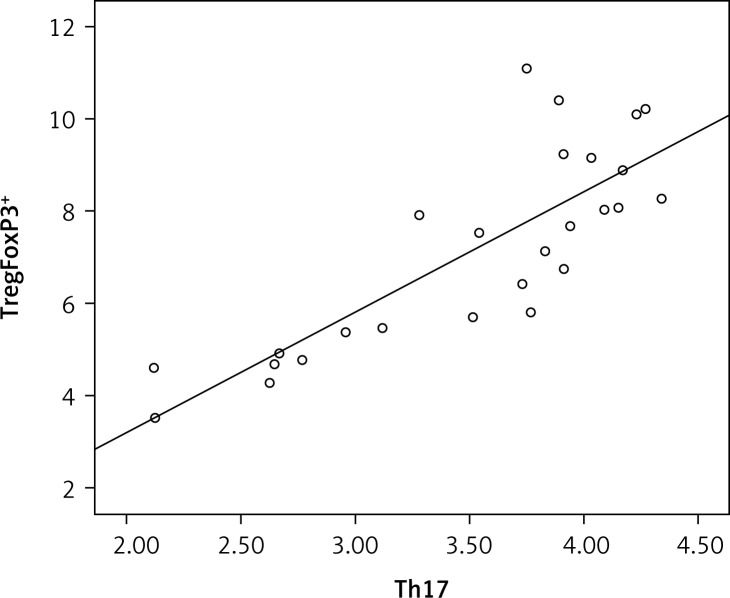
Figure 3.
TregFoxP3 + and Th17 correlation analysis in NSCLC patients. The linear correlation method was used. The sign and the absolute value of a correlation coefficient describe the direction and the magnitude of the relationship between two variables. The value of a correlation coefficient ranges between –1 and 1. The greater the absolute value of a correlation coefficient, the stronger the linear relationship. In our study the correlation coefficient (r) between TregFoxP3 + and Th17 was 0.81

