Figure 4.

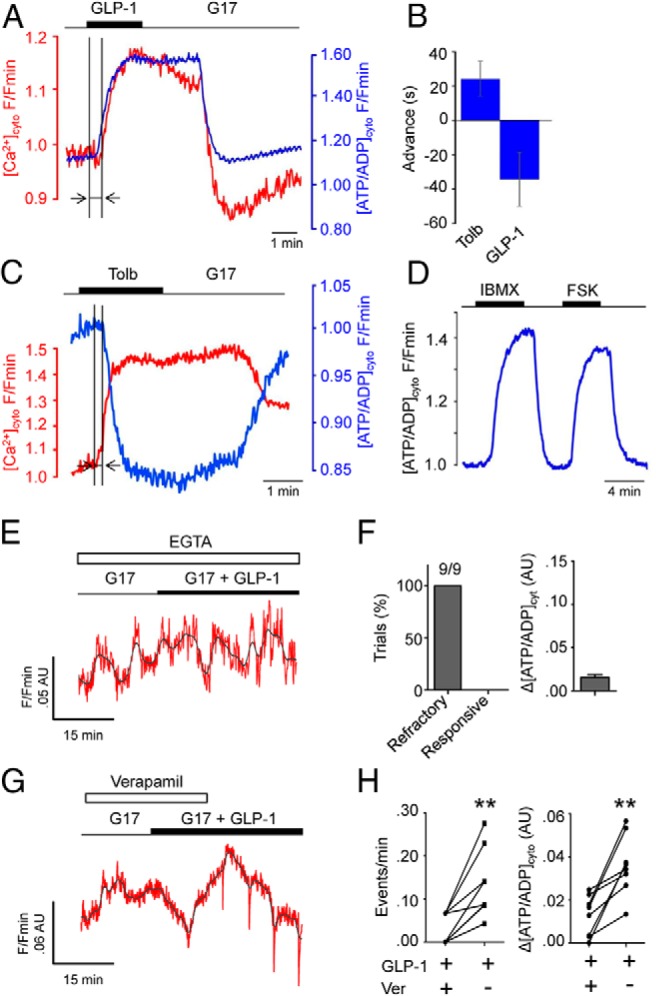
GLP-1 alters beta cell metabolism to initiate the Ca2+ influx required to support further [ATP/ADP]cyto increases. A, Simultaneous recordings of Perceval (blue) and Fura-Red (red) in single beta cells reveal that GLP-1-stimulated ATP rises precede those of Ca2+ influx. B, Summary bar graph showing the advancement of [ATP/ADP]cyto responses relative to those of Ca2+ when cells are stimulated with GLP-1 (measured period is shown with arrows on A and B) (n = 5 recordings). C, As for A, but 200 μM tolbutamide (Tolb) to stimulate large increases in Ca2+ and ensuing ATP consuming processes (n = 5 recordings). D, Representative traces showing effects of 10 μM forskolin (FSK) and 100 μM isobutylmethylxanthine (IBMX) on [ATP/ADP]cyto in dissociated beta cells (n = 5 recordings). E, Extracellular Ca2+ chelation using EGTA suppresses ATP-responses to GLP-1 (representative trace from n = 11 recordings; red, smoothed; gray, raw). F, EGTA blocked GLP-1 actions in all experiments conducted (9/9). G, As for E, but in the presence of 10 μM of the L-type VDCC blocker verapamil. H, Verapamil (Ver) abolishes GLP-1-induced [ATP/ADP]cyto dynamics and rises (**, P < .01 vs GLP-1 + verapamil, Student paired t test, n = 11 recordings).
