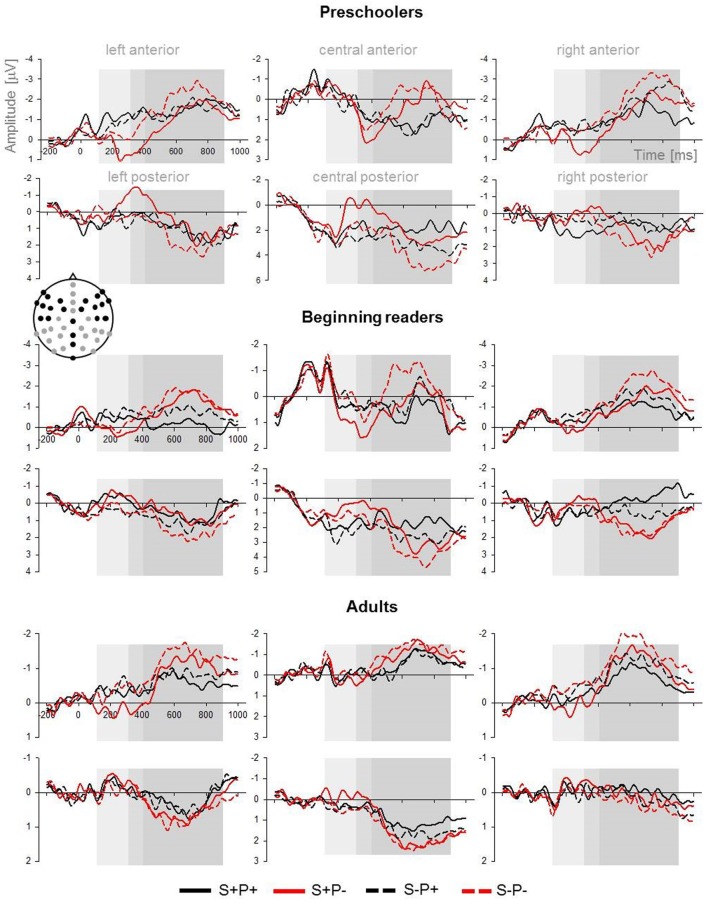
Figure 3.
Mean ERPs over the lateral (left and right) and central and over the anterior and posterior ROIs for each group. Black and gray dots on the head montage indicate the electrode positions that contributed to the ROIs. The three time windows analyzed in greater detail are highlighted in gray.

