Figure 6.

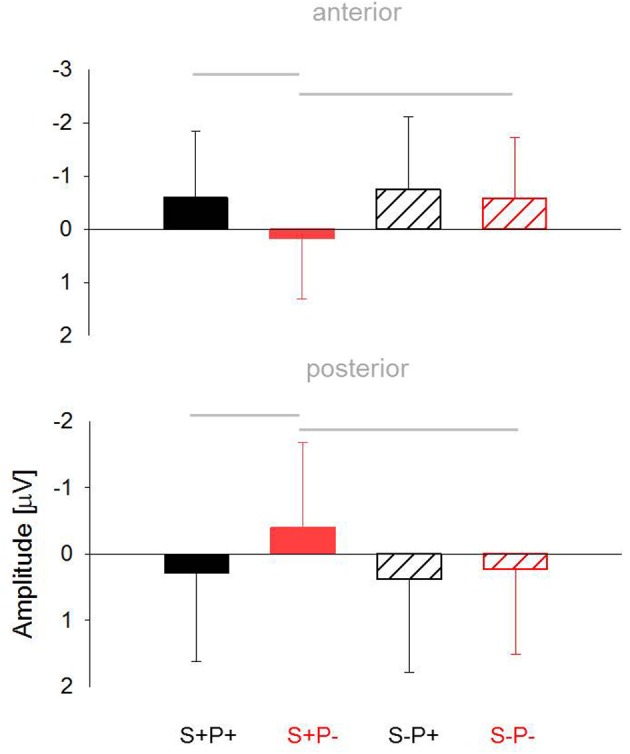
Mean ERP-amplitudes between 300 and 400 ms elicited for the anterior (upper panel) and posterior (lower panel) ROIs across all groups. Gray lines indicate significant differences between conditions, as revealed by post-hoc t-tests.

Mean ERP-amplitudes between 300 and 400 ms elicited for the anterior (upper panel) and posterior (lower panel) ROIs across all groups. Gray lines indicate significant differences between conditions, as revealed by post-hoc t-tests.