Fig. 2.
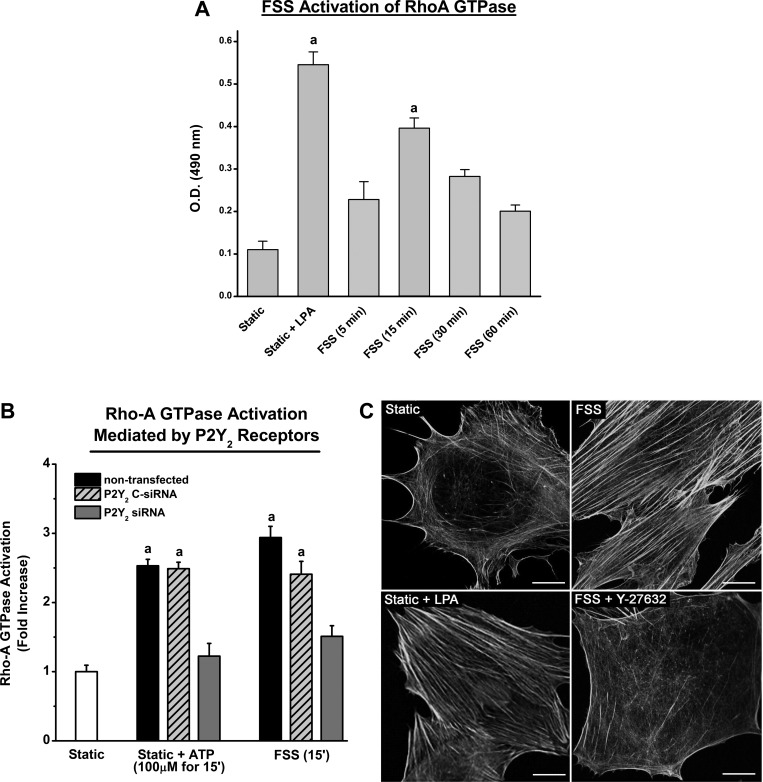
RhoA GTPase is activated during FSS to form stress fibers due to the activation of P2Y2R. A: RhoA GTPase was measured in MC3T3 cells at different time points following the onset of FSS (12 dyn/cm2). Treatment with 1 μM lysophosphatidic acid (LPA) under static conditions elicited a maximal activation of RhoA GTPase (∼6-fold). The maximum increase in RhoA GTPase activation during FSS occurred 15 min after the onset of stimuli and was approximaely four times greater than compared with static controls (a indicates P value <0.05 compared with static control). B: G-LISA assay was used to measure RhoA GTPase activation in response to ATP treatment and FSS in nontransfected cells and cells transfected with P2Y2R siRNA. The peak RhoA GTPase activation occurred 15 min after the onset of either ATP treatment or FSS in nontransfected cells. This peak was nearly abolished with the suppression of P2Y2R. Cells transfected with C-siRNA did not exhibit any significant differences compared with nontransfected cells. aP value <0.05 compared with static control. C: MC3T3-E1 cells, stained for F-actin, exhibited a diffuse organization of actin under static conditions compared with cells exposed to FSS (12 dyn/cm2) for 60 min. LPA treatment (10 μM for 30 min), which activates RhoA GTPase, significantly increased the ASFF. Inhibition of ROCK with 10 μM Y27632 during FSS significantly inhibits ASFF. Bar indicates 20 μm.

