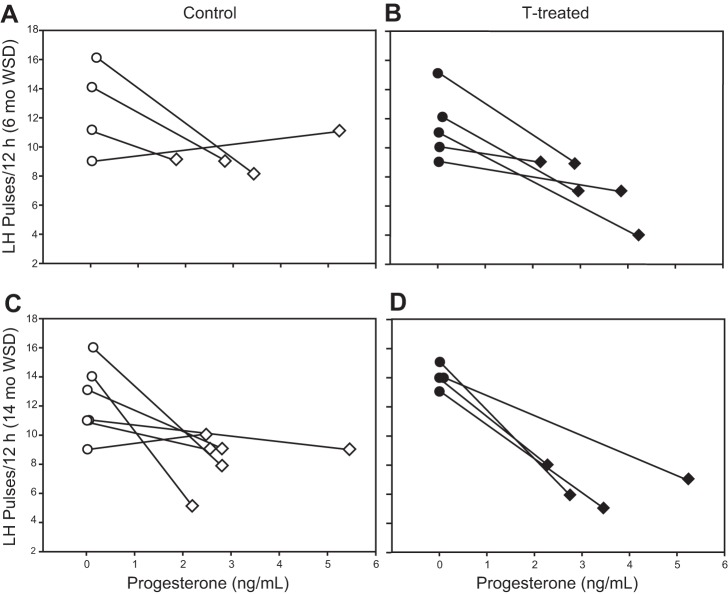
Fig. 3.
Suppression of LH pulsatility in the luteal phase compared with the early follicular phase of the menstrual cycle after 6 (A and B) and 14 (C and D) mo on the WSD. Each panel shows LH pulse frequency on D1–3 (circles) and during the luteal phase (diamonds) as a function of average progesterone values on the day of blood sampling. Data from individual animals are connected by lines. Data are shown from control animals, 6 mo WSD (A); T-treated animals, 6 mo WSD (B); control animals, 14 mo WSD (C); and T-treated animals, 14 mo WSD (D).

