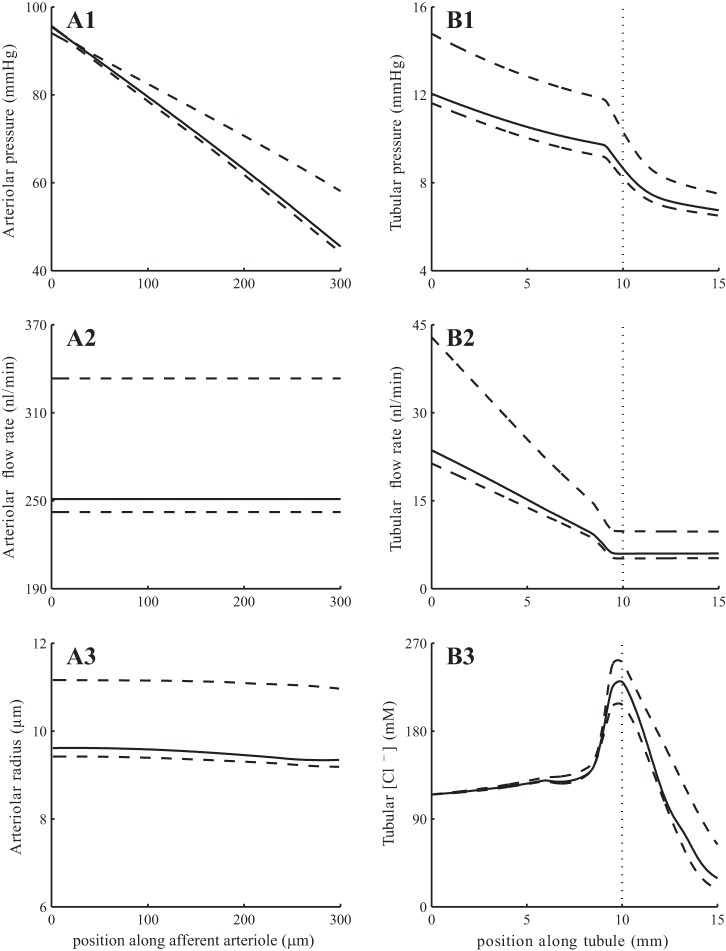
Fig. 5.
Base-case spatial profiles for afferent arteriole and tubular fluid pressure (A1 and B1), fluid flow (A2 and B2), arteriolar resistance (A3), and tubular fluid [Cl−] (B3). Solid lines show profiles obtained at time 15 s; associated envelopes are shown in dashed lines. Dotted lines in B1–B3 indicate loop-bend position.

