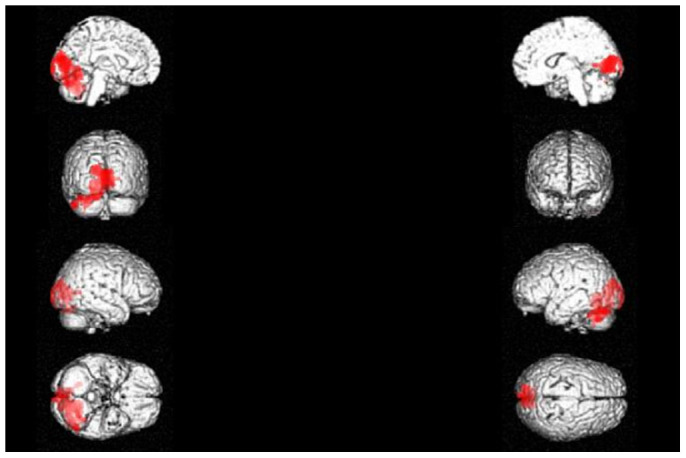
Figure 2. 3D rendering showing the cluster of voxels in the cuneus, lingual gyrus, parahippocampal gyrus and declive of cerebellum mainly in the left hemisphere, in which FDG uptake was significantly higher at OC (n = 11) as compared to NC (n = 11).

The first row represents the medial aspect of left (on the left) and right (on the right) hemispheres; the second row represents the anterior (on the left) and posterior (on the right) aspect on the brain; the third row represents the lateral aspect of the right (on the left) and of the left (on the right) hemispheres; the fourth row represents the inferior (on the left) and the superior (on the right) aspects of the brain. Coordinates and regional details are presented in Table 2.
