
Figure 1.
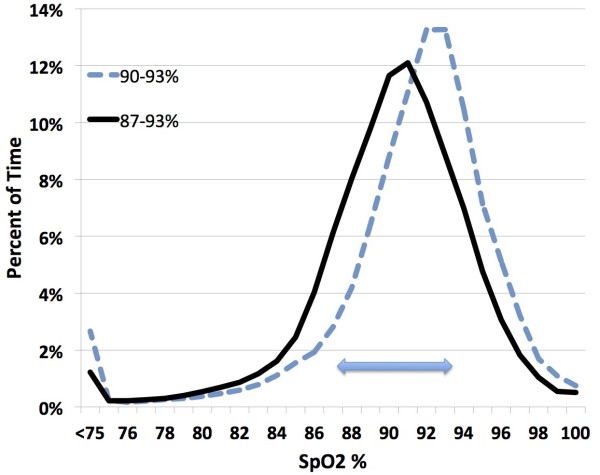
Histogram of SpO2 exposure for the two Control Ranges. The bar highlights the standard target range (87-93% SpO2).
Official websites use .gov
A
.gov website belongs to an official
government organization in the United States.
Secure .gov websites use HTTPS
A lock (
) or https:// means you've safely
connected to the .gov website. Share sensitive
information only on official, secure websites.
Histogram of SpO2 exposure for the two Control Ranges. The bar highlights the standard target range (87-93% SpO2).