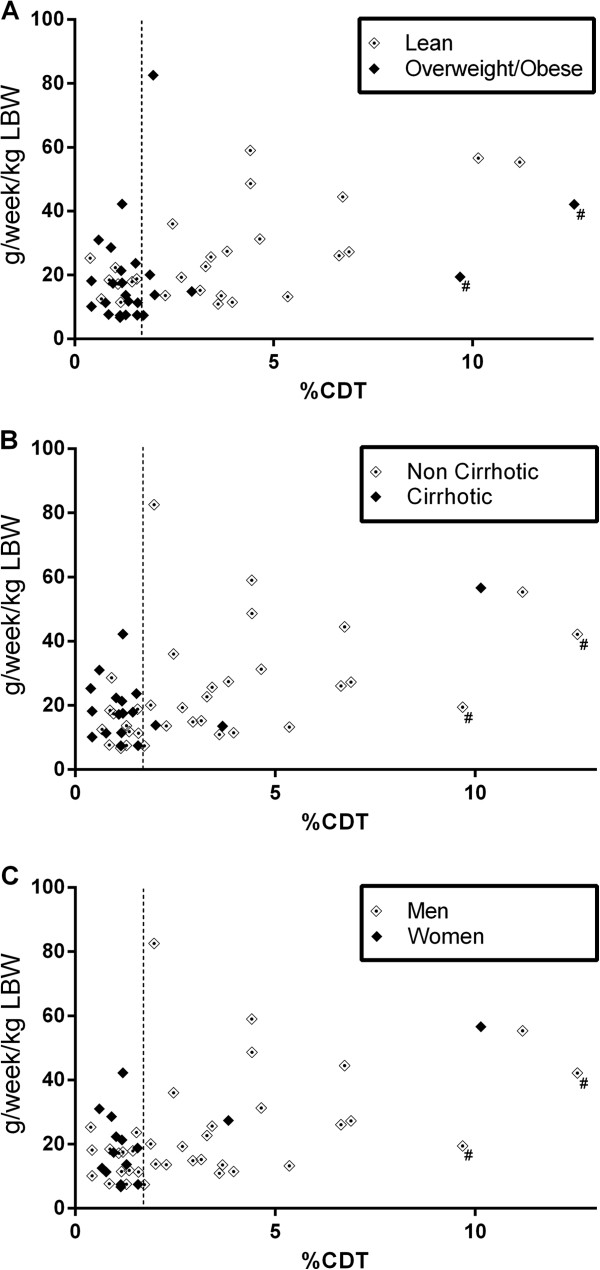
Figure 1.

Correlation of alcohol consumption (g/wk/kg LBW) and %CDT for: (A) lean vs. overweight/obese subjects; (B) non cirrhotic vs. cirrhotic subjects; and (C) men vs. women. (#identifies the 2 patients with moderately decreased renal function (eGFR 30–59)). (LBW = Lean body weight). The vertical line represents 1.7% CDT.
