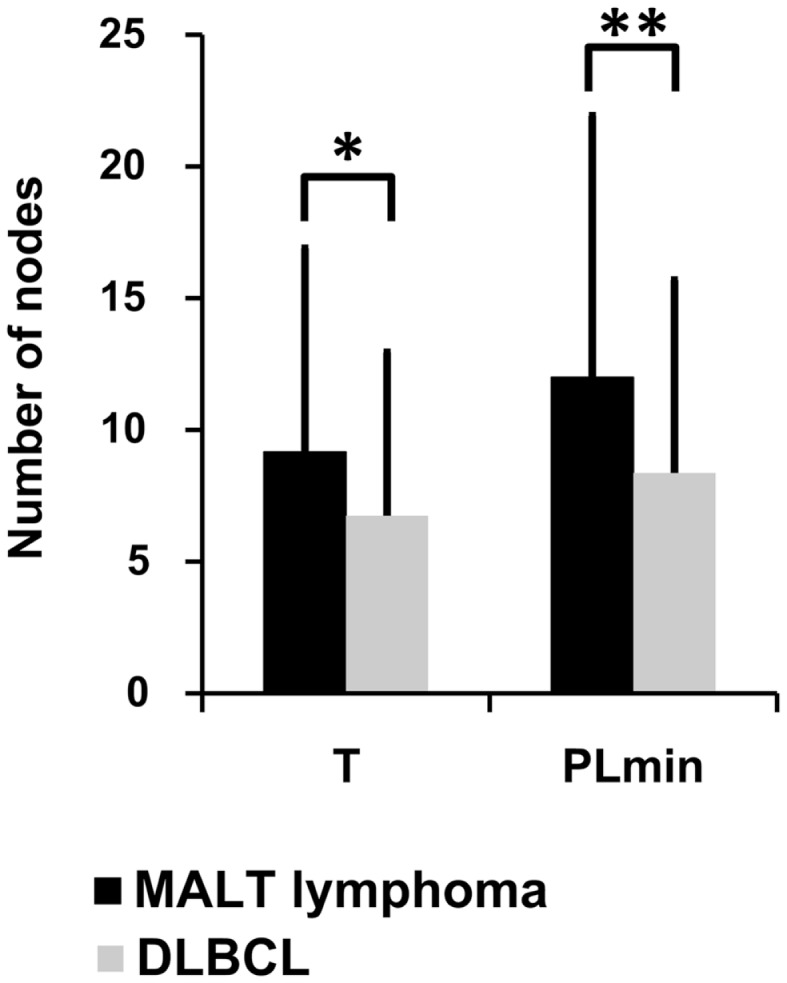
Figure 4.

Lineage tree analysis – comparison between dominant clones from the three MALT-L samples (24 trees) and the five DLBCL samples (47 trees). There was more than one tree per sample, as we included all clones with the same VH and JH genes (but different alleles) in the dominant clone in each sample, because they might be related to the dominant clone and falsely attributed to other alleles. Significant differences were found in trunk length (T) and minimal path length (PLmin). An asterisk (*) represents p-value <0.01; two asterisks (**) represents p-value <0.005.
