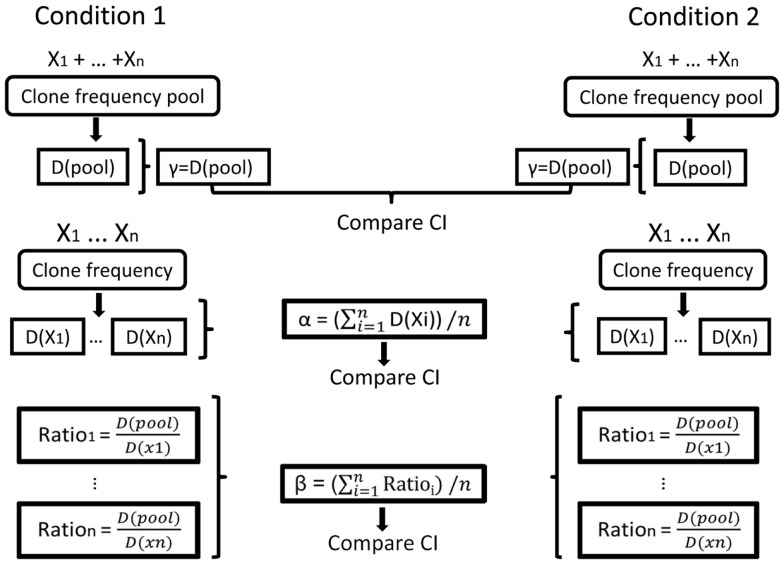
Figure 5.
Illustration of the calculation of repertoire diversity. First, the diversity indices (Shannon entropy, Simpson concentration index, etc.) are calculated for the pool of samples in each condition and also for each sample separately (samples are denoted by X1, …, Xn. Diversity indices are denoted by D (sample) or D (pool)). Next, the distribution measures (α, β, γ) are calculated for each condition using the samples. γ is the pool diversity, α is the mean sample diversity, and β for each sample is γ divided by D (sample). Finally, the CIs of the distribution measures are compared between the populations/conditions.

