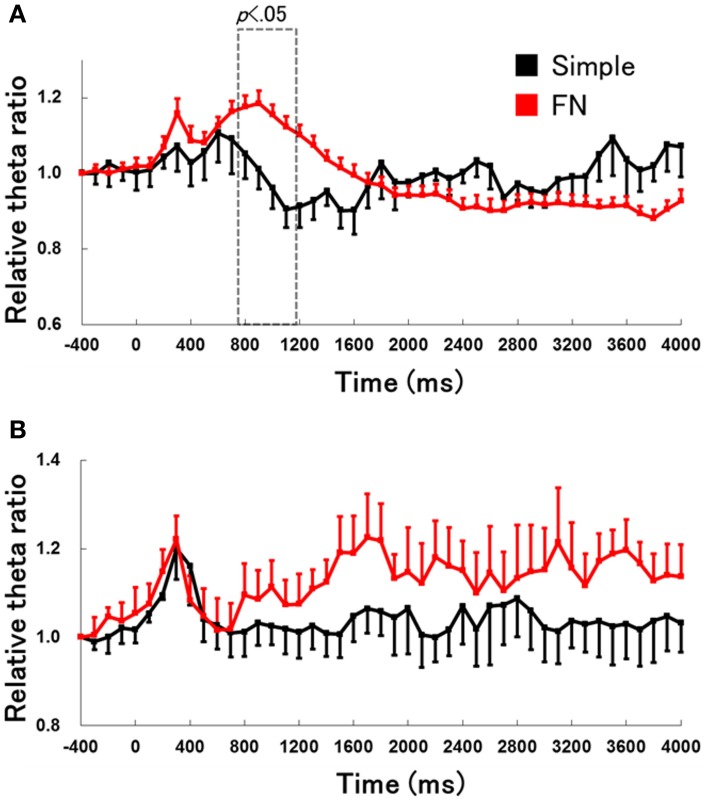
Figure 8.
The change in hippocampal theta power during the RFTs (A) and non-RFTs (B) of the early learning stage of the simple discrimination and FN tasks. The 0-ms period indicates the onset of stimulus presentation. The period was divided into 45 sub-periods of 100 ms each. The mean hippocampal theta power from 500 to 400 ms before the stimulus onset was counted as the −400-ms period (no stimuli were present and no rats pressed the lever during this period), and the relative theta power calculated for each period was normalized to that of the −400-ms period (relative theta power of each period = theta power of each period/theta power at the −400-ms period). The hippocampal theta power increased in 800- to 1100-ms epochs during RFTs in the early learning stage of the FN task compared with in the early learning stage of the simple discrimination task (all p < 0.05). Error bars indicate s.e.m.

