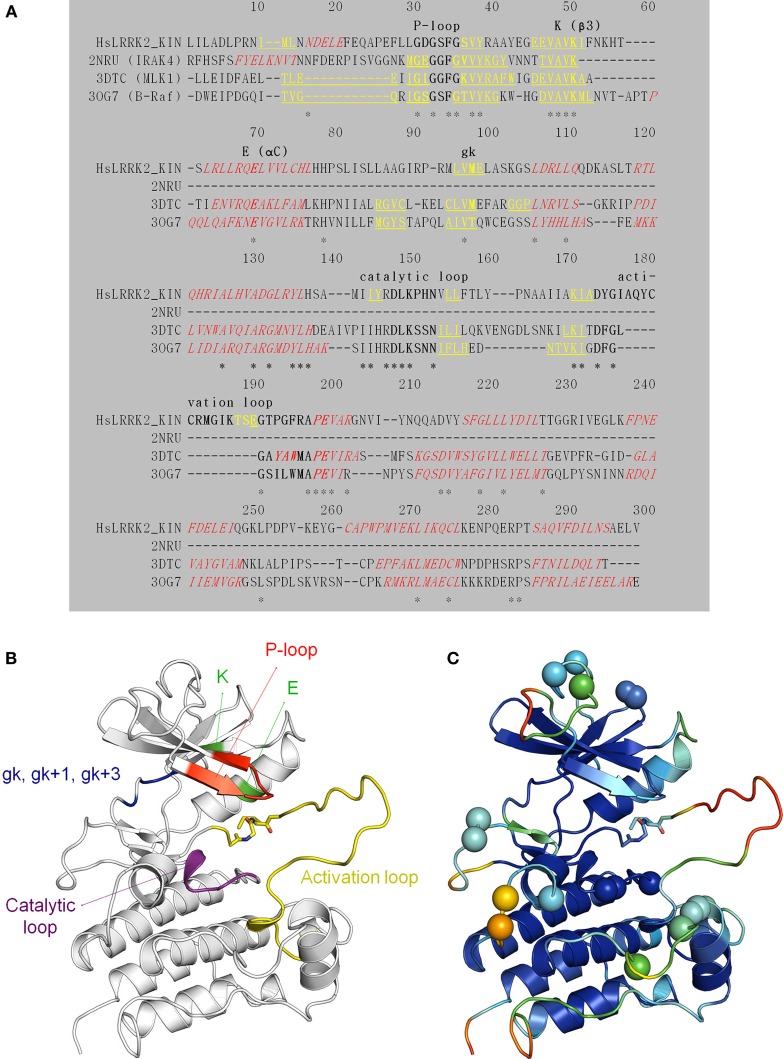
Figure 6.
Structural modeling of the LRRK2 kinase domain (residues 1859–2138). (A) Target (the LRRK2 kinase domain)—template (2NRU, 3DTC, and 3OG7) alignment (see Table 3 for an overview of available structural templates of TKL kinases). Secondary structure elements (predicted for LRRK2 via NetSurfP or obtained from the 3D PDB structure) are indicated: α-helices are red italic, and β-strands yellow underlined. The conserved motifs are highlighted in bold and labeled. Identical residues are marked with an asterisk (*). (B) Illustration of the LRRK2 kinase homology model depicting key residues and functional features. The P-loop is shown in red, the conserved K in β 3 and E in αC in green, the catalytic loop in purple, the activation loop in yellow, the gatekeeper (gk), gk + 1, and gk +3 residues from the hinge region in blue. Sticks colored by CPK convention correspond to the residues that are affected by the G2019S and I2020T mutations segregating with PD. G2019S is part of the beginning of the activation loop. (C) Graphical representation of potential errors in the homology model as predicted by Meta-MQAPII. The color spectrum from blue to red reflects the accuracy of the 3D residue prediction from correct to incorrect respectively. The spheres indicate the position of the residues in the disallowed and generously allowed regions of the Ramachandran Plot and residues with unfavorable bond angles and dihedrals. Figures generated with PyMol.

