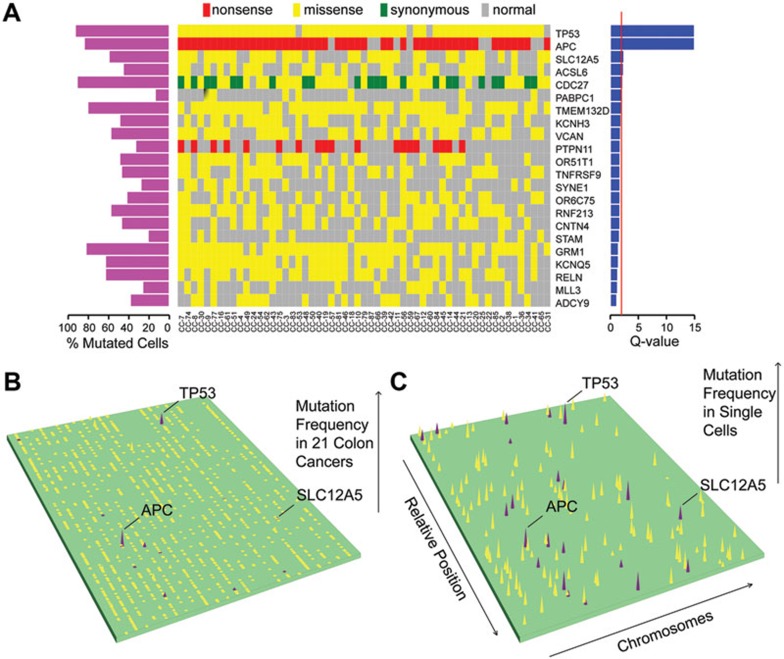
Figure 5.
The mutation landscape and driver-gene prediction. (A) The matrix in middle shows mutations grouped by mutation types, which were identified in the major clone. The length of left bar represents the mutation frequency of single cells. The length of right bar represents the predicted driver gene Q-score. (B) The somatic mutation landscape in the additional colon cancer cohort study. The height of each gene reflects the mutation frequency in these cancers. (C) The somatic gene mutation landscape in single cells. The genes with estimated Pr(mutated)/Pr(normal) > 9 were considered as mutated genes.

