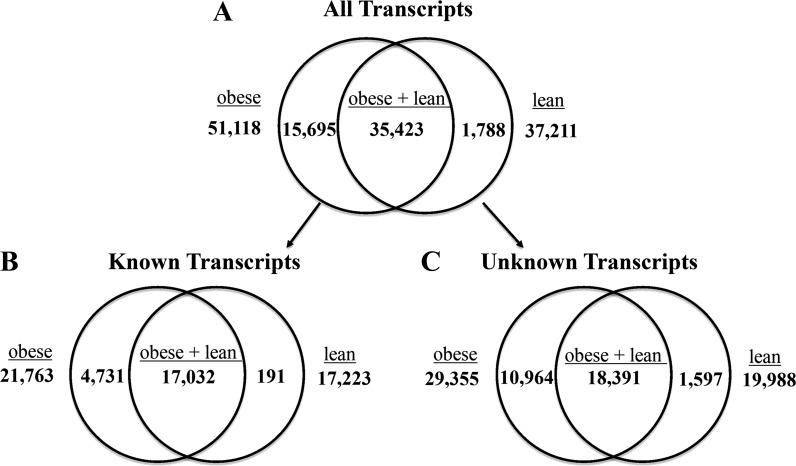
Fig. 2.
Quantification of expressed transcripts between treatments. Reads per kilobase per million reads (RPKM) values representing each transcript were assessed and had to be >0 for all biological replicates in both groups, obese and lean, for inclusion in this analysis. No additional filtering or statistical analyses were performed on above values. A: all transcripts analyzed (RPKM > 0, both known/annotated and unknown/nonannotated). B: annotated transcripts for which identity is known. C: nonannotated transcripts for which identity is unknown.

