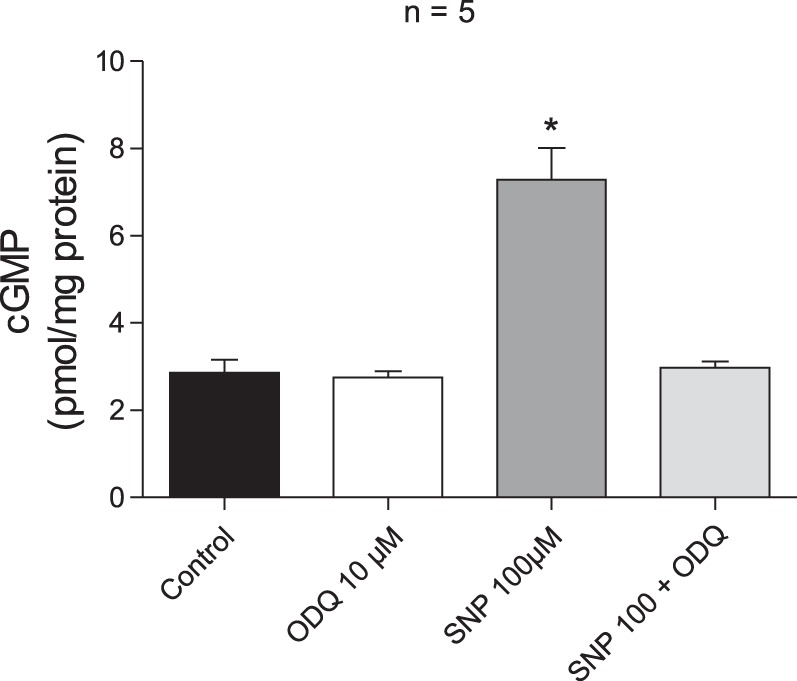
Fig. 9.

Bar graph showing cGMP levels in pulmonary arterial segments under control conditions, following treatment with 10 μM ODQ, 100 μM SNP, and combined treatment with 100 μM SNP and 10 μM ODQ. n, No. of experiments. *P < 0.05 compared with control.
