Fig. 1.
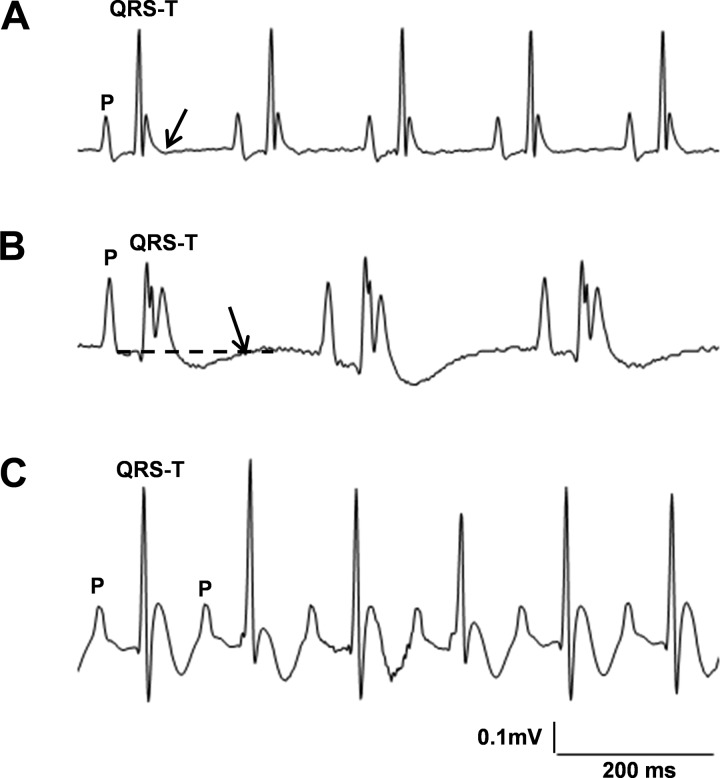
ECG patterns from anesthetized mice show marked variability. A: recorded from a wild-type (WT) mouse; the QRS-T complex ends with an upright T-wave that then returns to the isoelectric baseline (arrow). B: recorded from an Scn5a+/ΔKPQ mouse; the positive part of the T-wave is followed by a negative undershoot before returning (arrow) to the isoelectric baseline (dashed line). C: recorded in a WT mouse, 10 min after administration of isoprenaline (2.0 mg/kg ip); the T-waves show negative undershoot components, not fully separable from the succeeding P-waves.

