Fig. 2.
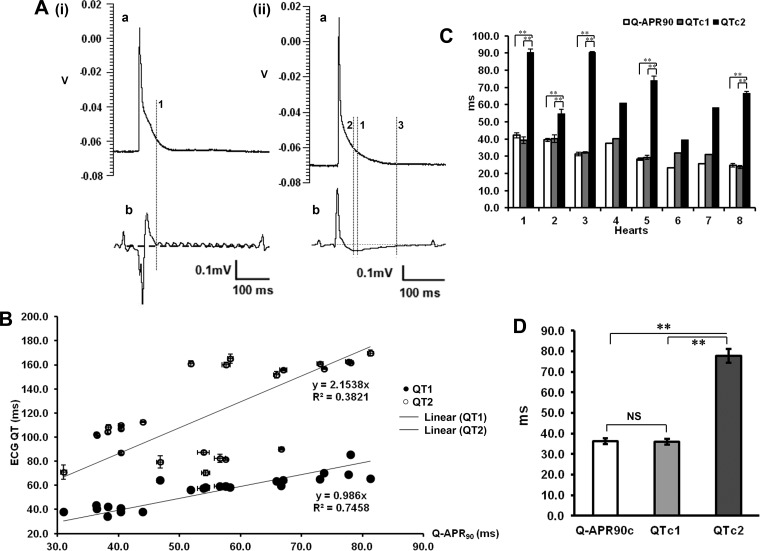
Relationships between intracellular action-potential (AP) duration and volume ECG QT intervals in WT hearts. A, (i) and (ii): APs (a) and the corresponding ECG recordings (b). Cursor 1 indicates the AP at 90% recovery (Q-APR90). Cursor 2 is placed at the minimum value of a late negative undershoot (QT1). Cursor 3 indicates the point where the undershoot component regains the isoelectric baseline (QT2). V, volts. B: plots of QT1 and QT2 intervals against Q-APR90 values observed and their respective regression lines. C: summarization of corrected Q-APR90 (Q-APR90c) and corrected QT1 and QT2 (QTc1 and QTc2, respectively), resulting from 8 individual hearts. Results from hearts 1–8 were obtained in the course of recording from n = 6, 4, 3, 1, 5, 1, 1, and 3 cells, respectively, of which, ECG records in hearts 2 and 6 showed a kinetic pattern, generally similar to that in A, (i), b, whereas the remainder showed more complex kinetic patterns similar to that in A, (ii), b. D: summarization of mean (±SE) Q-APR90c, QTc1, and QTc2 values. **P < 0.01.

