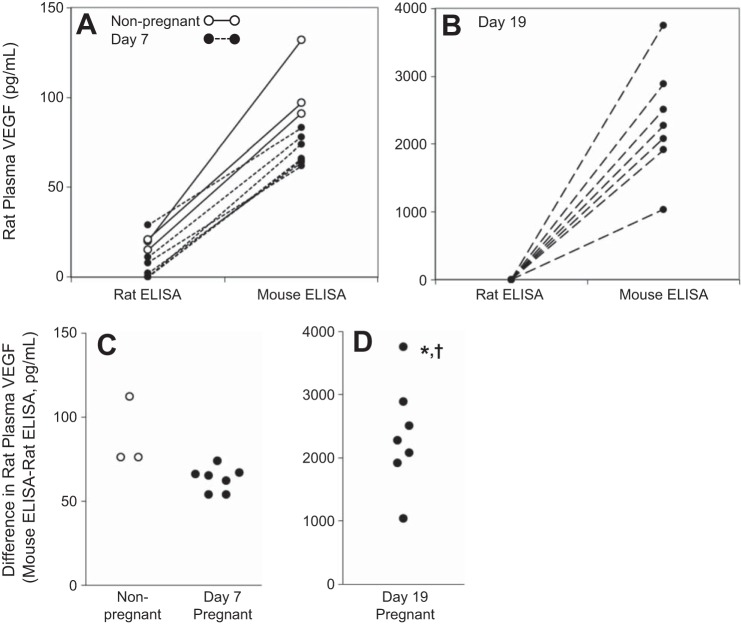
Fig. 2.
Rat plasma VEGF measured by the rat and mouse ELISAs. Lines represent the same sample, run on the rat and mouse ELISAs, in nonpregnant (A, n = 3), day 7 pregnant (A, n = 7), and day 19 pregnant (B, n = 7) rats. The difference between the mouse and rat ELISAs (C, D) was most pronounced in day 19 pregnant rats (note the difference in scale from A and B). The panels are designed to show paired data; hence some overlapping data points are obscured in A and B. Figure 1 shows VEGF concentrations measured on the rat ELISA with no overlapping data points. Significant difference from: nonpregnant rats, *P < 0.5; day 7 pregnant rats †P < 0.05.

