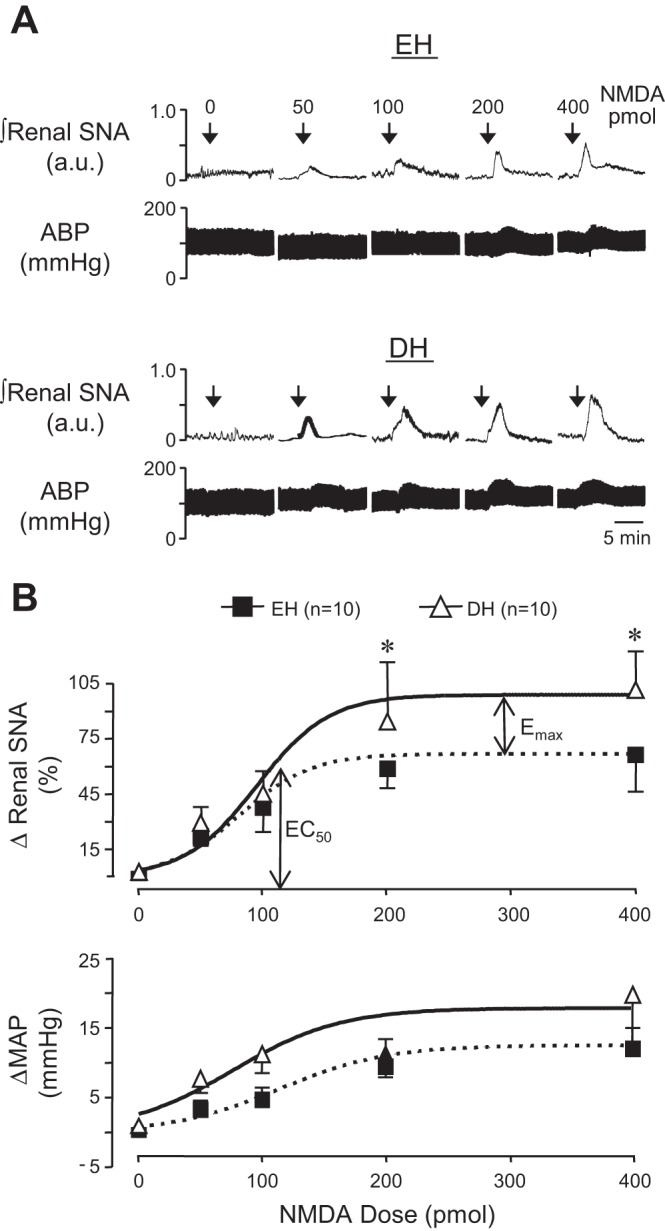
Fig. 3.

A: representative examples of renal SNA and ABP responses to PVN microinjection of graded doses of NMDA in an EH (top) and DH (bottom) rat. B: summary data illustrating peak changes of renal SNA and MAP in response to graded doses of NMDA microinjected into the PVN of control and DH rats. Data were fitted with a sigmoidal variable slope dose-response function to illustrate that, whereas the EC50 dose elicited similar responses across groups, the maximum agonist evoked response (Emax) response of renal SNA was significantly increased in DH compared with EH rats. *P < 0.05 vs. EH.
