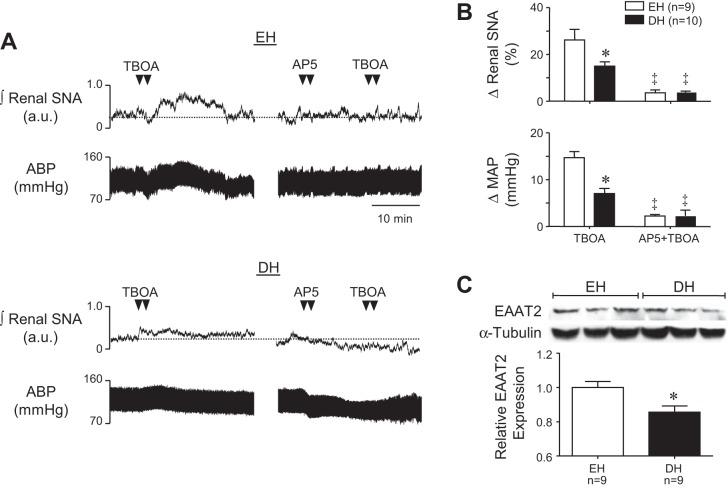
Fig. 5.
A: representative examples of renal SNA and ABP responses to PVN microinjection of the nonspecific glutamate transporter inhibitor dl-threo-β-benzyloxyaspartic acid (TBOA) (left) and AP5+TBOA (right) in an EH and DH rat. B: summary of peak changes of renal SNA (top) and MAP (bottom) in response to PVN microinjection of TBOA (250 pmol/50 nl) and TBOA+AP5 in EH and DH rats. C: protein expression of excitatory amino acid transporter-2 (EAAT2) in PVN samples measured by Western blot analysis. Mean data of band densities of EAAT2 relative to α-tubulin was significantly decreased in DH rats. *P < 0.05 vs. EH. ‡P < 0.05 vs. TBOA alone.

