. 2013 Dec 9;14(Suppl 8):S10. doi: 10.1186/1471-2164-14-S8-S10
Copyright © 2013 Tyagi et al.; licensee BioMed Central Ltd.
This is an Open Access article distributed under the terms of the Creative Commons Attribution License (http://creativecommons.org/licenses/by/2.0), which permits unrestricted use, distribution, and reproduction in any medium, provided the original work is properly cited. The Creative Commons Public Domain Dedication waiver (http://creativecommons.org/publicdomain/zero/1.0/) applies to the data made available in this article, unless otherwise stated.
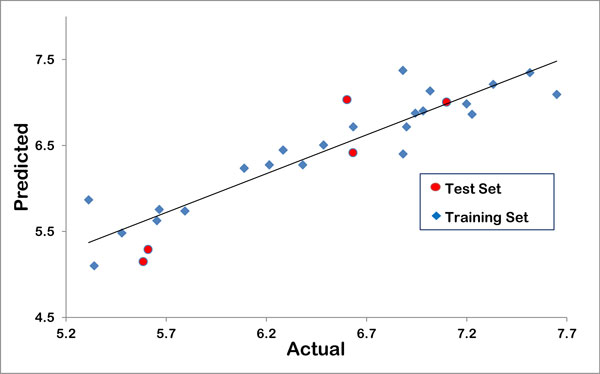
Figure 1.

Graphical representation of observed vs. predicted activity for training and test set.
