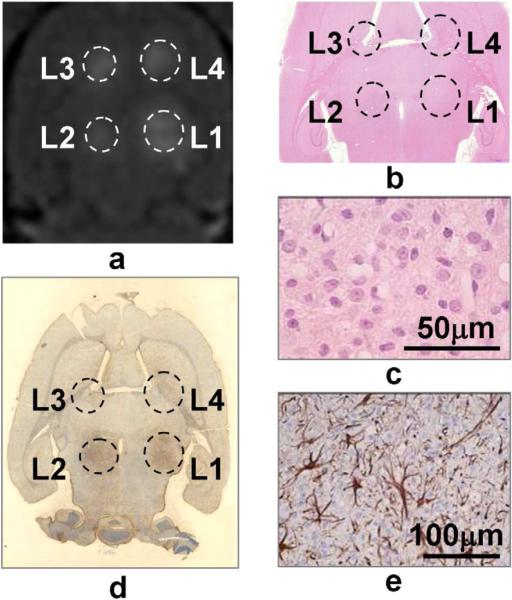
Figure 3.
Results of one animal sacrificed in 7 days. Sonication was 10ms/Hz, 5 min, at 366, 444, 267 and 300 kPa at L1-L4, respectively. Image (a) is the Gd-enhanced T1-weighted image showing the BBB disruption following sonications. H&E stained image (b) found no residual hemorrhage. The zoom-in at L2 (c) shows cellular infiltrations of a mixture of astrocytes and macrophages. Gross GFAP staining (d) and zoom-in at L2 (e) reveal reactive astrocytes at the region of sonication.

