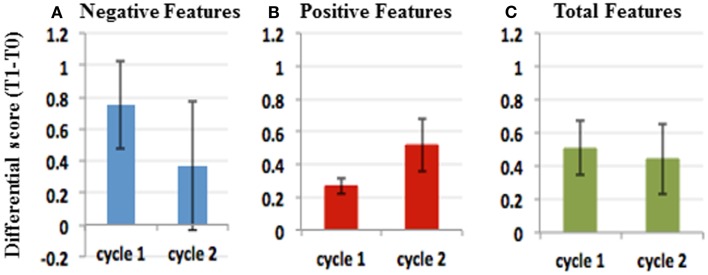
Figure 2.
Effects of IGF1 treatment differ in different treatment cycles. Plots of average (T1–T0) and SE in cycle 1 and cycle 2 for Negative features (A), Positive features (B), and Negative plus positive features (C). The data suggest that the negative features improved more in the first cycle than in the second (A). Conversely, the positive features improved more in the second cycle than the first. (B) Considering both positive and negative features, the effect of the treatment was comparable in both cycles (C).

