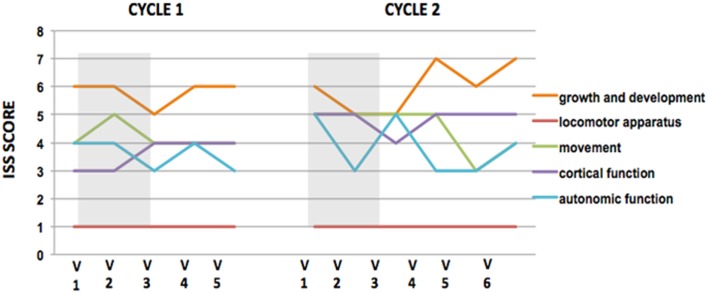
Figure 3.
ISS scores plots during IGF1 cycles of treatment. ISS scores reveal that IGF1 improves autonomic function. Plots of International Severity Scale (ISS) score at each visit during cycle 1 (left) and cycle 2 (right) of IGF1 administration. Gray rectangles show the IGF1 Administration. Higher scores represent worst performance. In both cycles, the IGF1 treatment improved the autonomic function, while the other parameters remain unchanged or worsened between the beginning and the ending of each cycle. Note that the improvement is not maintained between cycles.

