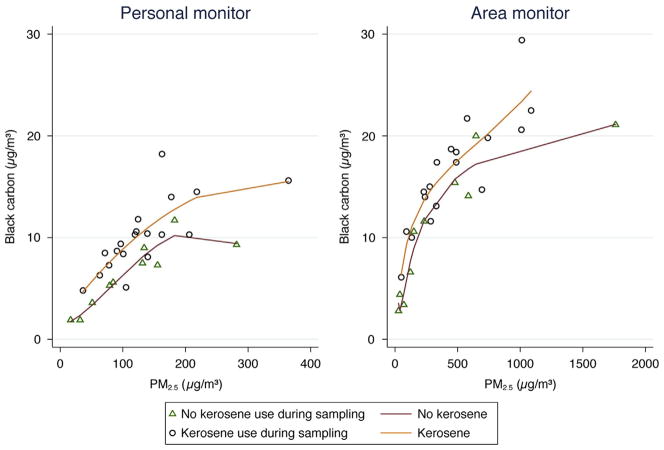
Fig. 1.
Black carbon concentrations for personal and area samples across households reporting kerosene lantern use and households reporting no kerosene lantern use during exposure monitoring period. A fractional polynomial fit was used to allow a semi-quantitative comparison of black carbon exposures as a function of PM2.5 level indicating that both personal and kitchen samples were similarly enriched by black carbon when kerosene use was reported.

