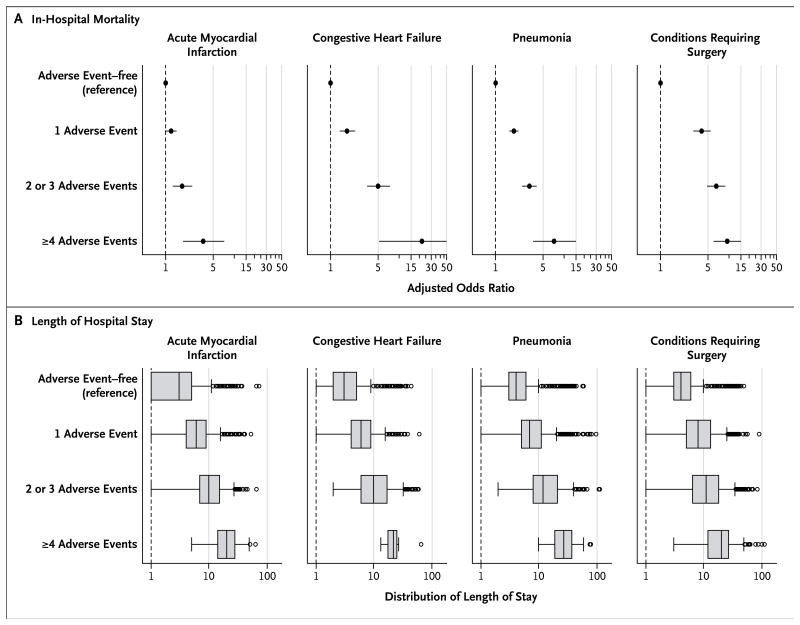
Figure 2. Association of Adverse Events with In-Hospital Mortality and Length of Stay, on the Basis of 2010–2011 Data.
The association between adverse events and in-hospital mortality (Panel A) is expressed as an adjusted odds ratio for each of the three dummy variables: one adverse event, two or three events, and four or more events, as compared with no adverse events. An odds ratio greater than 1 indicates that a patient with this characteristic is more likely to die during a hospitalization than a patient without any adverse events. The horizontal lines indicate 95% confidence intervals. The association between adverse events and length of stay (Panel B) is shown in box-and-whisker plots. The vertical line inside each box represents the median value; the left and right boundaries of each box represent the 25th and 75th percentiles, respectively. The left and right vertical lines outside each box (“whiskers”) represent the values that are 1.5 times below the 25th percentile and above the 75th percentile, respectively. The circles represent outliers.

