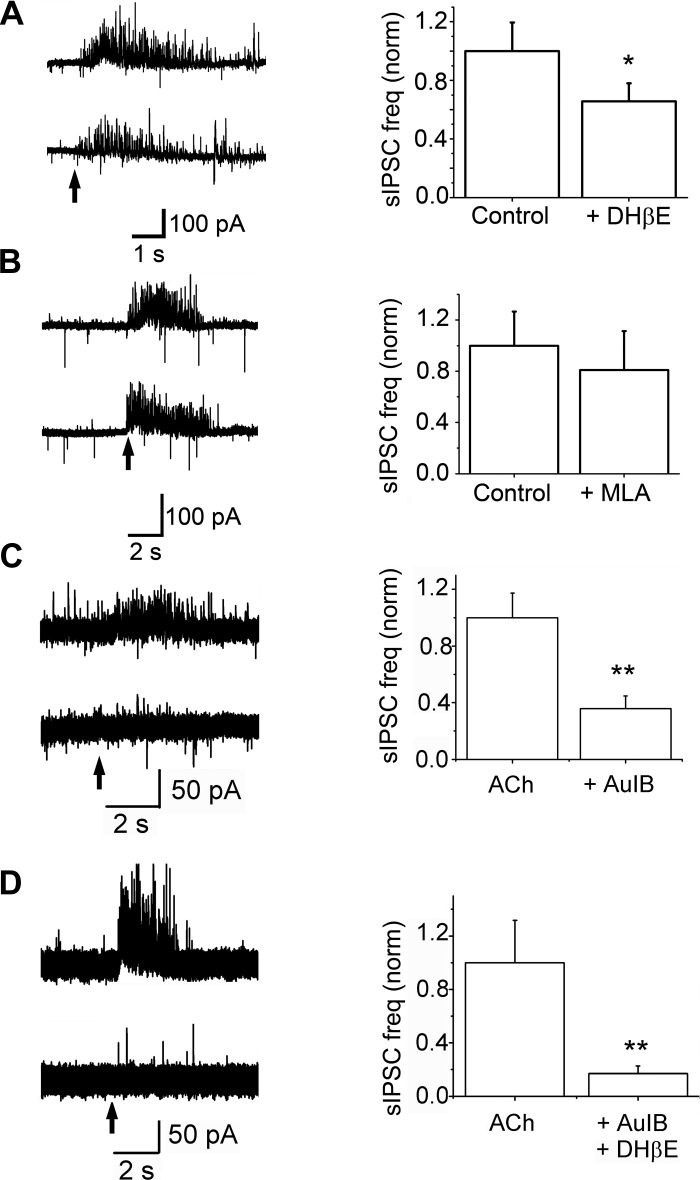
Fig. 5.
Pharmacology of nAChR-mediated increase in sIPSC frequencies. A, left: raw trace of an ET cell, held at −30 mV, under Cont conditions (top trace) and in the presence of 10 μM DHβE (bottom trace). Arrow indicates the start of a 1-s, 1 mM ACh/At application. Right: bath application of 10 μM DHβE results in a 33 ± 5% decrease in ACh/At-induced sIPSC frequency (n = 7, *P < 0.05). B, left: at −30 mV, ACh/At application (arrow) results in an increase in sIPSC frequency under Cont (top trace) as well as during bath application of MLA (bottom). Right: 10 nM MLA does not significantly change the sIPSC frequency increase caused by ACh/At application (n = 5, P > 0.5). C, left: raw trace showing ACh/At-induced increases in sIPSCs in the absence (top) and presence (bottom) of 10 μM CTx-AuIB applied for 3 min via a puffer pipette. Right: cumulative data from 5 cells. CTx-AuIB blocked the increase in sIPSC frequencies by 64 ± 9% (**P = 0.011, paired t-test). D, left: raw trace showing sIPSC increases in the absence (top trace) and in the presence (bottom trace) of 10 μM DHβE and 10 μM CTx-AuIB applied for 2 min as in C. Right: cumulative data from 7 cells. The two antagonists together blocked the sIPSC frequency increases by 83 ± 6% (**P = 0.02, paired t-test).

