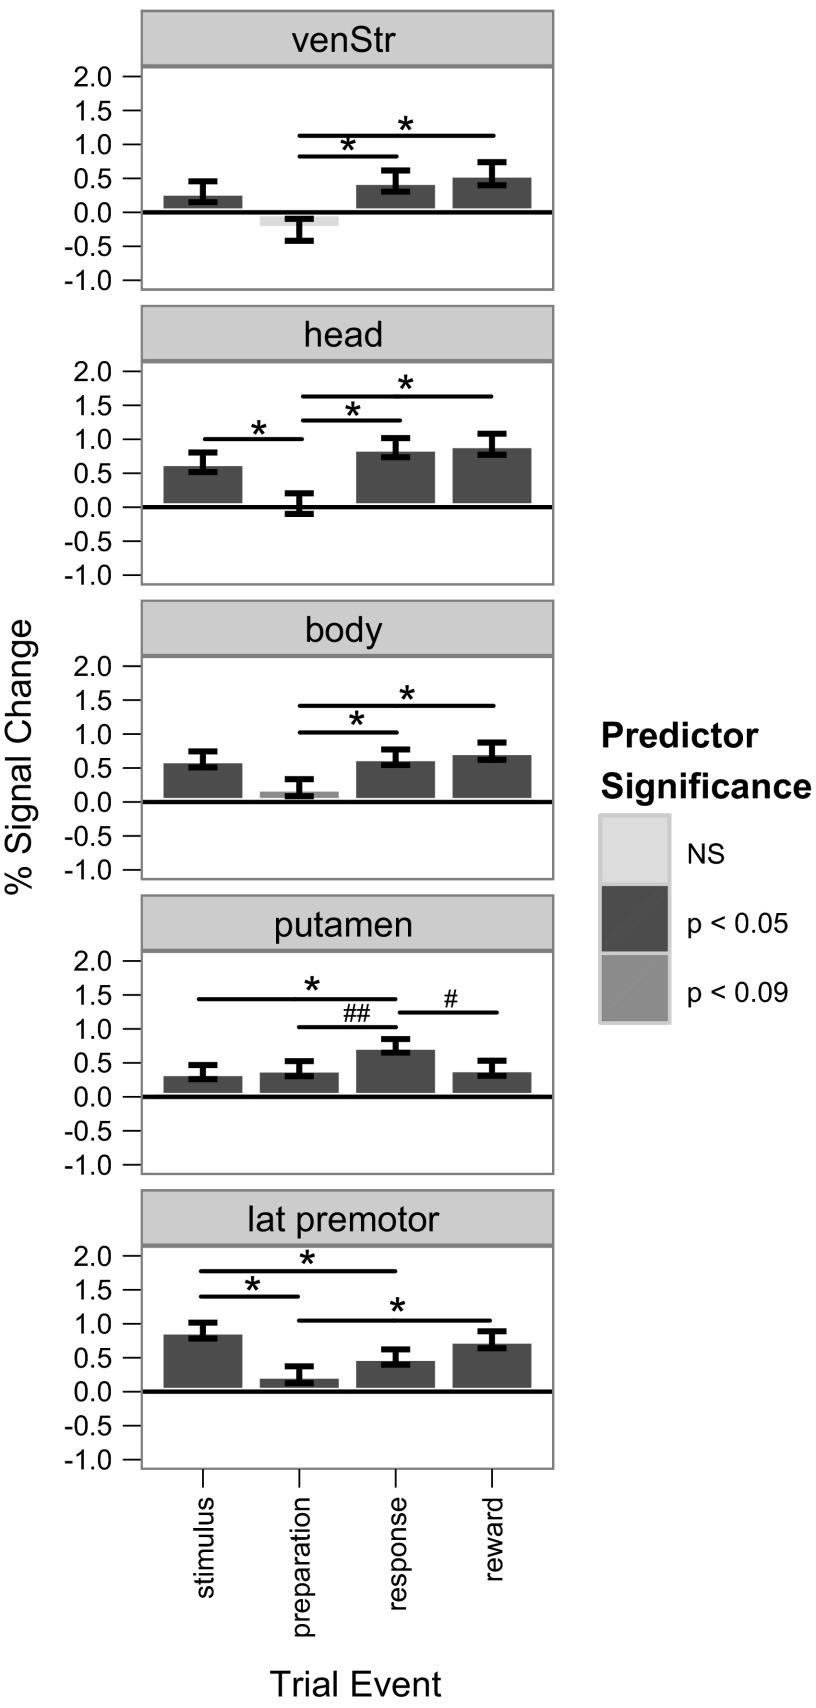
Fig. 7.
Average percent signal change for each of the 5 regions of interest for each trial component compared with the implicit baseline. The significance level of each predictor (synonymous here with %signal change) is indicated by the shading of each bar (see Predictor Significance key), whereas significant pairwise differences between predictors (assessed by Bonferroni-corrected 2-tailed t-tests) are represented by lines above the bars: *P < 0.05; #P < 0.01; ##P < 0.01. venStr, ventral striatum; lat premotor, lateral premotor cortex.

